


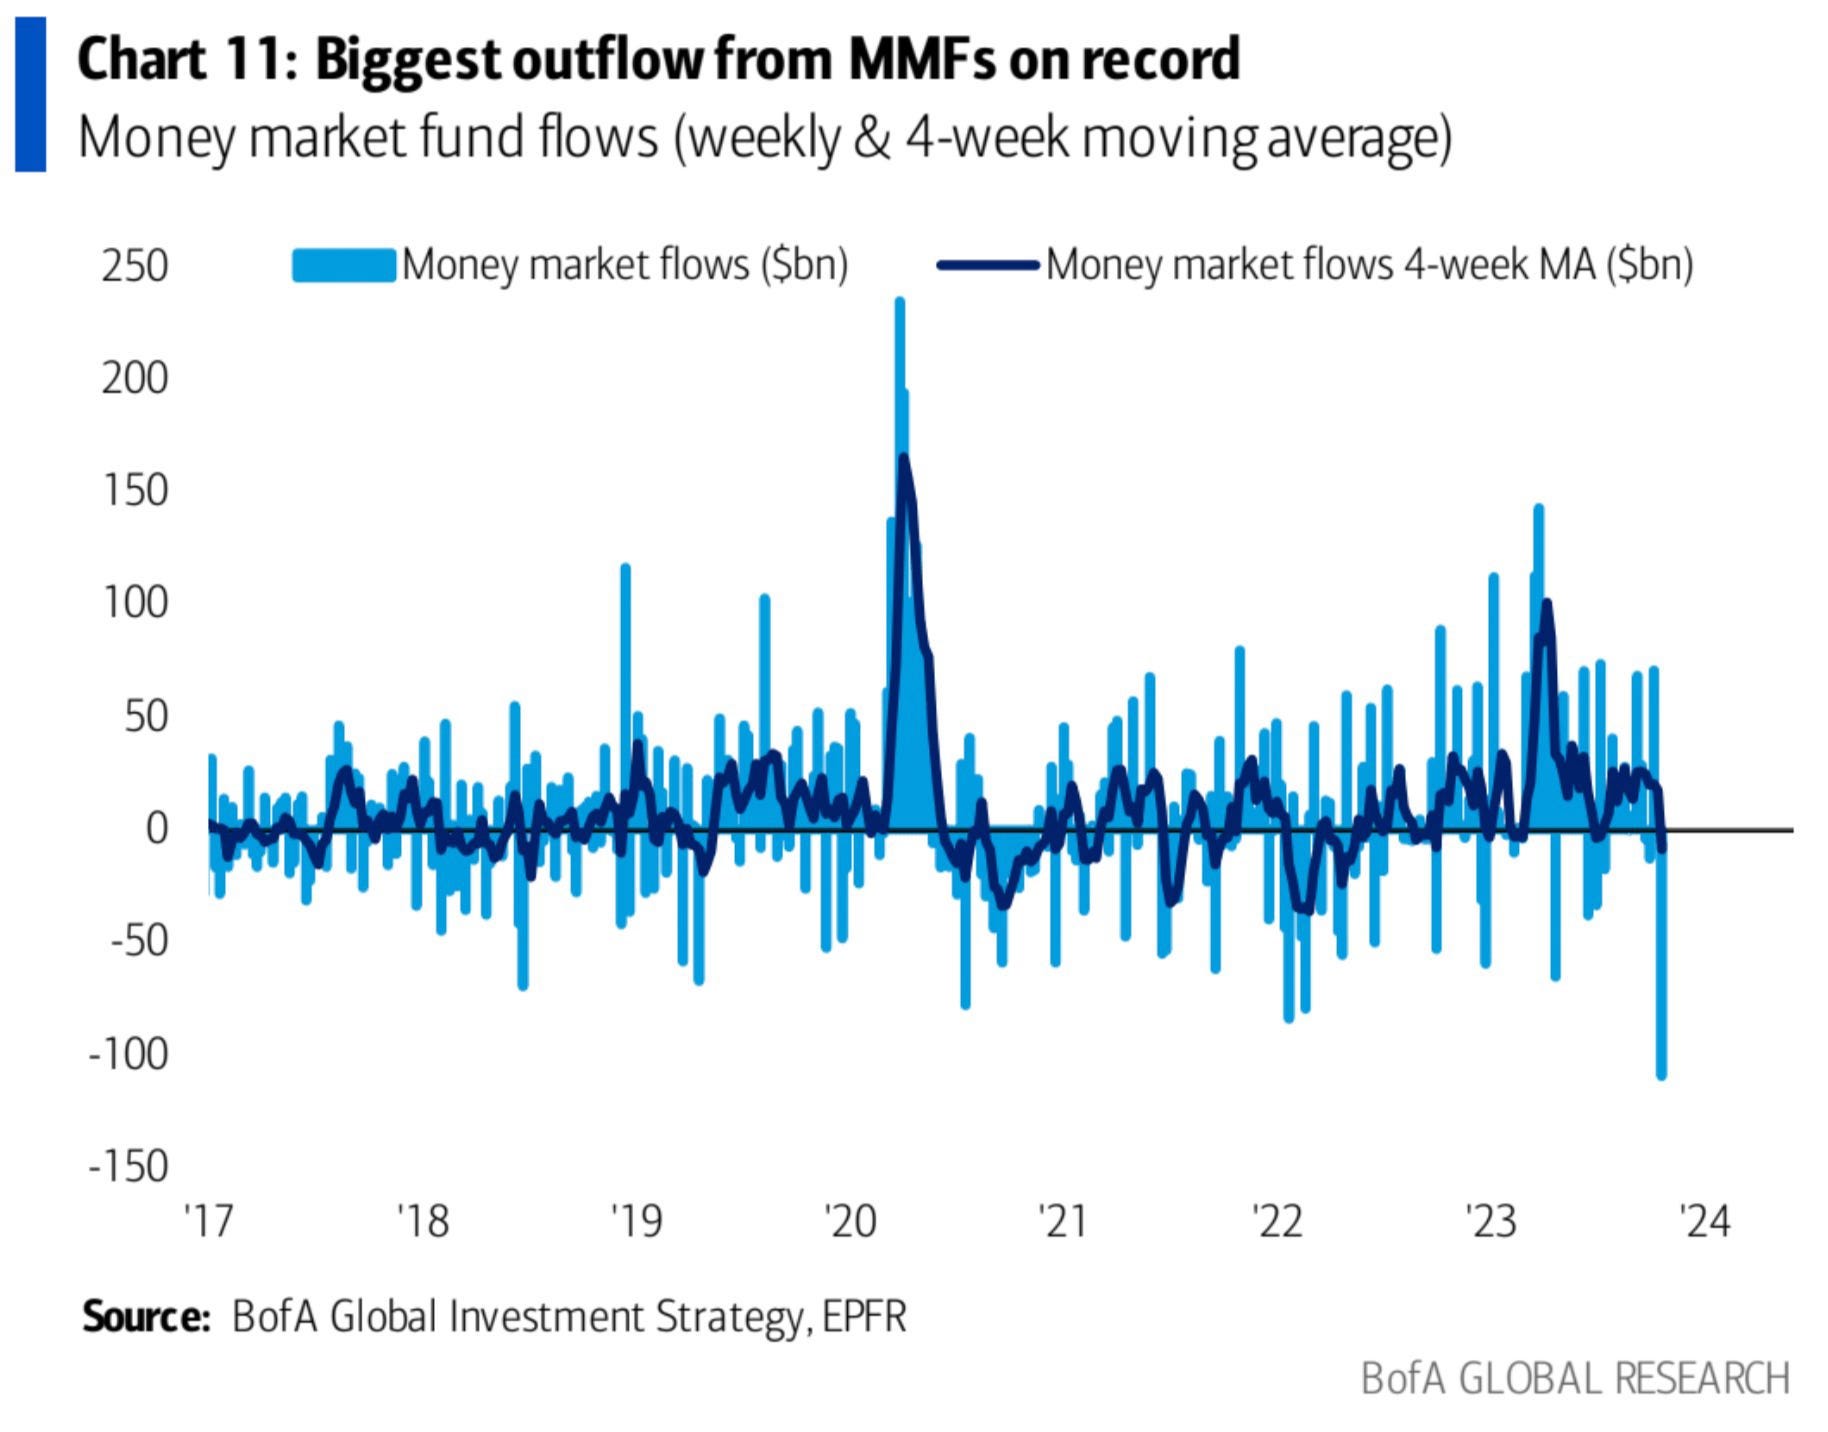
As we discussed in the last post, the Money Market Funds are going to be a key area to watch in the coming months, having sucked in vast amounts of liquidity during this tightening phase, when and how they unwind is going to be a key driver of markets. As such, we were interested to see the following Chart from BofA (courtesy of our friends at Redburn Atlantic), showing a record outflow.
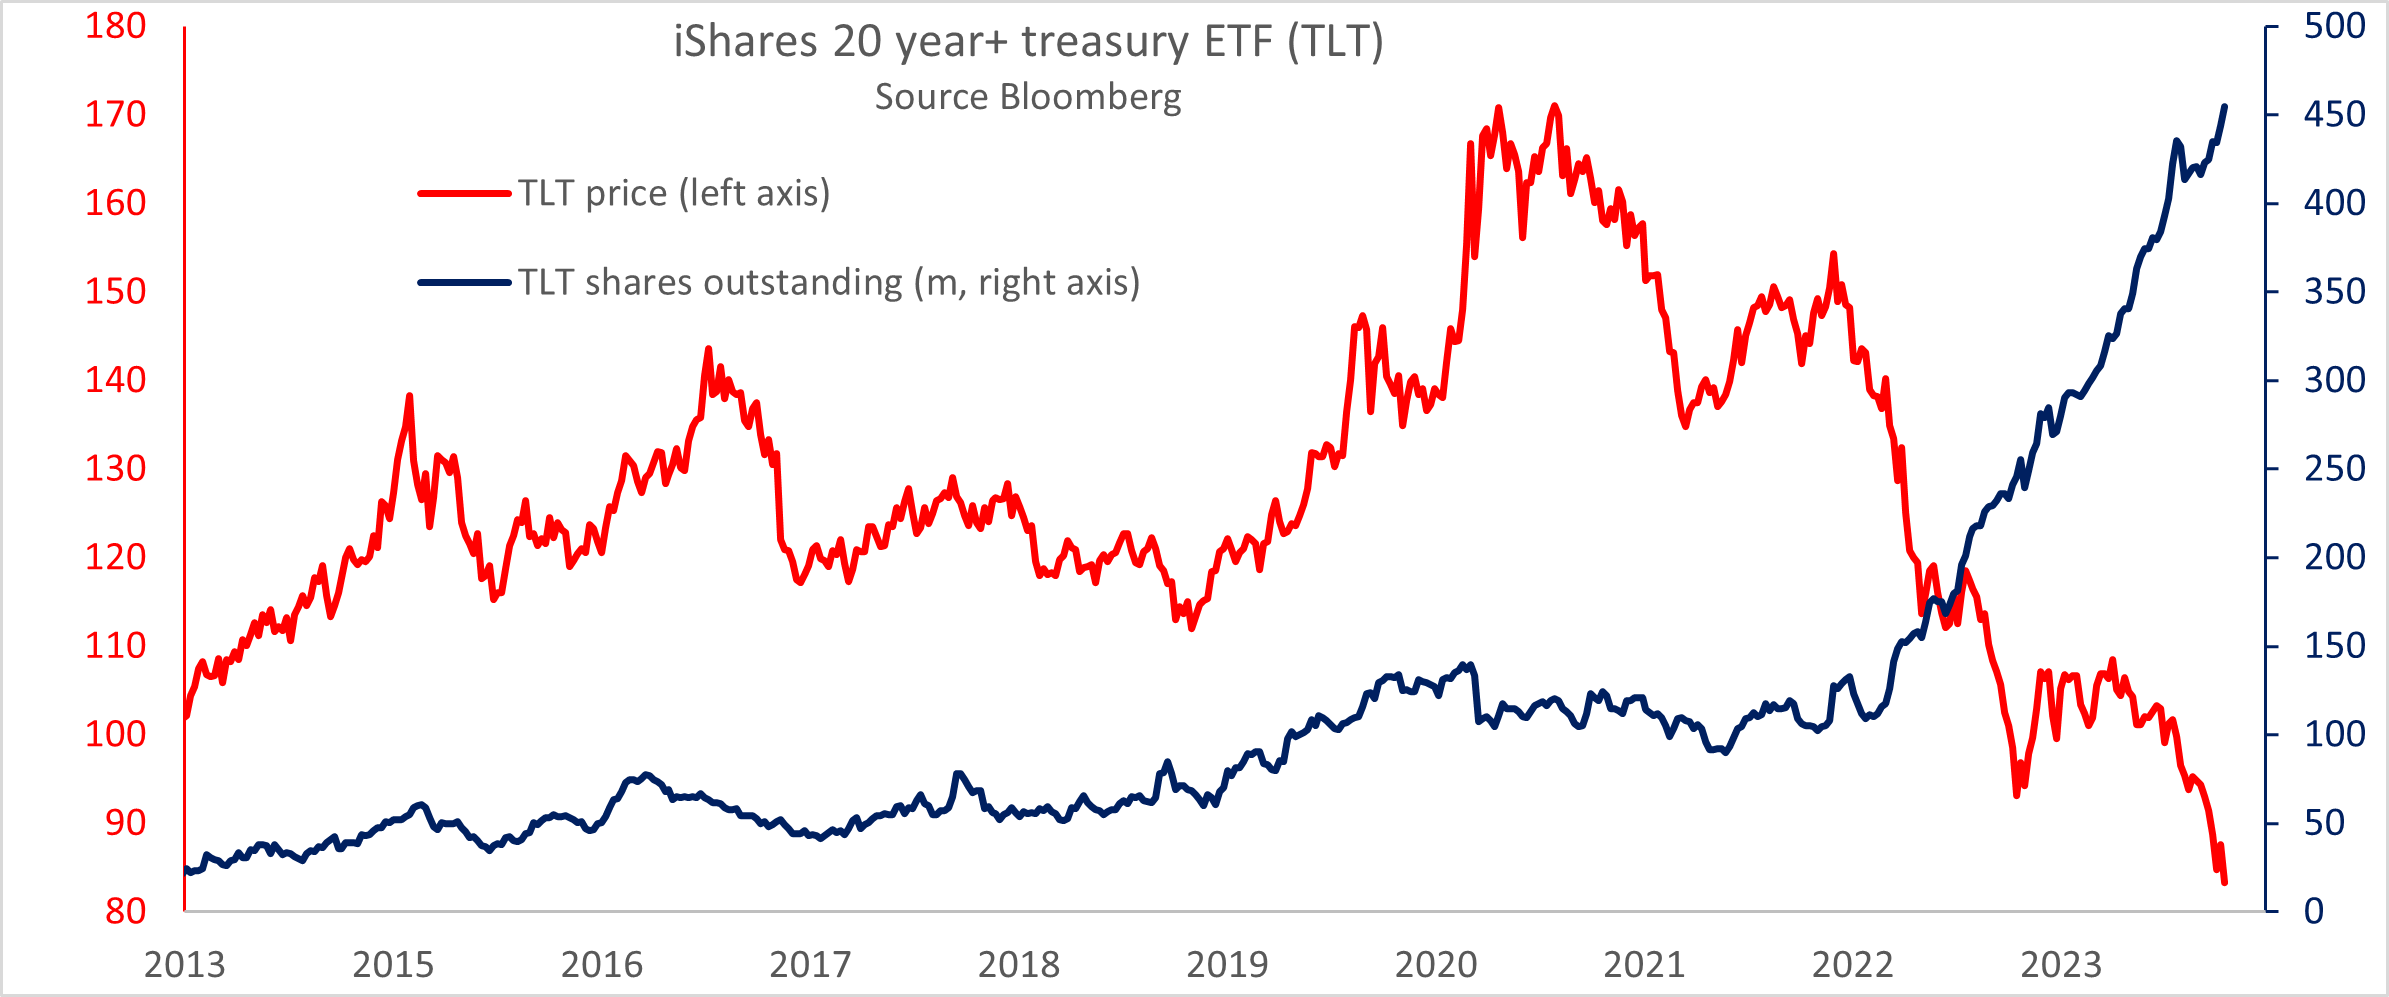
We were then also interested to see the following chart illustrating the flows into TLT, the long bond ETF, appearing to suggest that our thesis on long bonds and the asymmetric bond math(s) is perhaps already underway. While primarily retail, a lot of wealth management and semi institutional investors use ETFs as a simple way of getting exposure.
Thanks for reading Mark’s Substack! Subscribe for free to receive new posts and support my work.
Talking of flow, we also liked this third Chart from Nick and the team, illustrating another flow we have discussed recently, (in weak hands to strong hands) in this case out of China, shown here in the form of flows into and out of Emerging Market ETFs and those of Emerging Markets but ex China.
This is a classic example of risk avoidance by Asset Allocators.
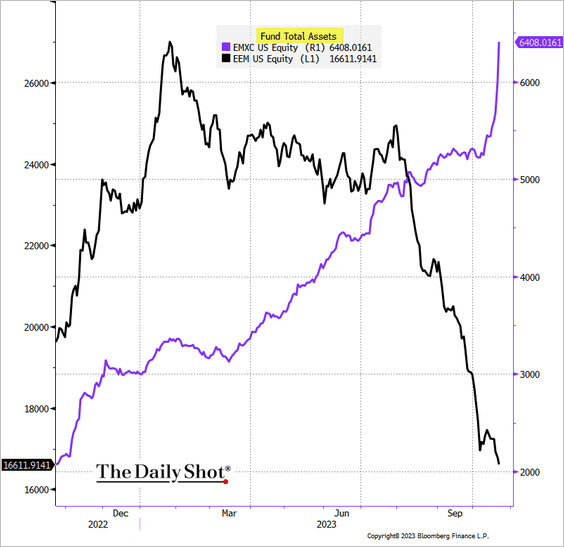
The inclusion of China in EM baskets was a clear driver of flows into China and currently the weighting is heavily China skewed with over 26%. Back in 2013, there were almost 1.2bn shares in issue in EEM, now it is around 450m. Meanwhile, the EMXC, which, while smaller is also newer and has gone from zero to 140m shares in the last 3 years. Interesting that TSMC is the largest stock in both indices.
In a similar fashion, we previously discussed how asset allocators were buying NASDAQ and selling S&P as a way of playing the mega tech trade through indices. Meanwhile, and continuing our rummage through Redburn’s chart deck, we also alighted on this chart, illustrating that in the Equity world, flows remain very narrowly focused on ‘The Magnificent Seven’.

As previously discussed, the first half of the year was all about this trade, the rise of the Magnificent 7, the megacap tech stocks, whose recovery from a dramatic self-off this time a year ago dominated returns, driving almost all the return of the S&P500. There was a brief period of catch up by the other 493 stock in early Q3, but the headline performance for the year to date is basically all about these few stocks.
Indeed, if we use the Bloomberg PORT function on the SPY ETF that tracks the S&P500, we see that the Magnificent 7 have added 9.95% between them in terms of total Contribution To Return (CTR) year to date. In effect these stocks make up 25% of the index and have returned an average of 38% (CTR is essentially average weight times performance).
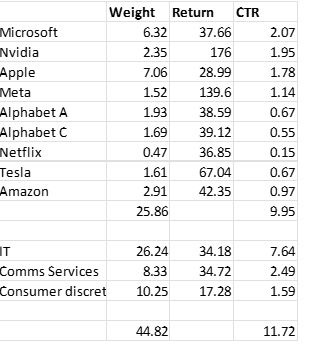
This is in fact slightly larger than the return for the whole market at 9.16%. As the table shows, the three sectors IT, Communication Services and Consumer discretionary, which make up 45% of the Index have returned 11.7%
Much of the squeeze in these stocks has of course been associated with AI hype which sets our Behavioural Finance spidey senses tingling, but also reflects the ‘rules based issues’ around passive investing in equites which are just as indifferent to fundamentals as some of the fixed income investing we were discussing in the previous post. Obviously we know that index trackers following the S&P500 will, by definition, be happy to have a portfolio with more than 10x as much in Amazon as in American Express, or more in Nvidia than in every company in the materials sector combined, but, as with bonds, there is the risk that the same forces driving things higher will switch to driving them lower. It doesn’t matter that the Magnificent Seven basket is on a P/E of 40x and a yield of 0.2%, versus 18.8x and 1.7% respectively for the S&P500, a combination of momentum and indexation is driving flow.
For example, as well as the broad market benchmarks, we also note that Microsoft, Nvidia, Meta and Alphabet, together with Novo Nordisk and Eli Lilly, make up 20-25% of the I-Shares Global Baskets for both Momentum and Quality, two of the Global Factors that we monitor in our model portfolios. In particular, we are interested in the Global Quality basket. which currently has a 0.8 correlation with Global Momentum year to date and a 0.56 correlation with the Bloomberg ‘Magnificent 7’ Index. And it’s not just passive either, look beneath the bonnet of many Global Growth Funds as well and you will find their top holdings heavily flavoured with the Magnificent 7.
Interesting then to see that, since the peak in July, they have been in a consolidation pattern in the Magnificent 7 Index, one that appears to have just broken down.
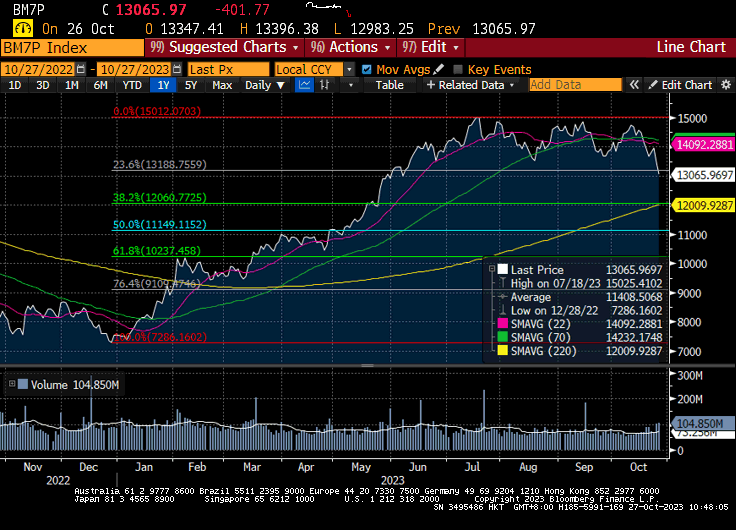
We have added the classic technical overlay of a Fibonacci retracement onto the Chart as this is often used by the shorter term momentum traders to set stop losses and targets. At this time of year we are aware that the approach of Thanksgiving is also the end of the trading year for many trading funds and the temptation to lock in profits is higher than usual.
Bottom Line
(Please note the usual caveat that this is not investment advice, please do your own research and contact your investment advisor). Money is starting to come out of Money Market Funds and its first stop we think is going to be into longer duration fixed income. The flows into TLT are an interesting early signal. At the same time the other flow from weak hands to strong hands we identified is for China stocks and that appears to be being played, at least in part by the switch from EM to EM ex China. Watching that forced selling slow down is thus a second signal to watch and we would note that the ratio between the two is currently stable since June, but very much at the bottom of the recent range. We suspect that these are probably the two big ‘value’ trades for 2024.
In addition we are also looking at the Magnificent 7 rolling over as first trading flow and then passive flows unwind the premium. At the same time we are watching the allocation proxy in NASDAQ v S&P500. For while on the one hand it has seemed to be ‘all about tech’ on the positive side, we shouldn’t forget that 2022 was a disaster for a long NASDAQ short S&P500 trade, dropping 20%. The cruelty of equity maths is that even though that ratio is up 20% this year, it still hasn’t got back to where it peaked at the end of 2021.
More important we think is that the money coming out of cash and destined for equities is more likely to be chasing quality, cash flow and dividend yield than dreams of AI. In our model porfolios we are currently heavily in cash and are looking at these sorts of thematics to drive the next phase in markets and assembling some new thematics to deploy as and when our conviction inicreases.
