


Market Outlook
Near term, the biggest challenge the equity and bond market faces is from cash. The high returns available for ‘no risk’ mean flows into money markets and money market ETFs are dominating everything and exaggerating the liquidity crisis in illiquid parts of the markets. Meanwhile, the Fed's (in our opinion extremely unwise) decision to keep upward momentum on short rates is having two effects, first, not just the level but the speed of the rate increases (far faster than any other hiking cycle in recent memory) is challenging a lot of businesses that rely on short term borrowing, creating some distressed selling in underlying assets.
After more than a decade of mis-allocating capital by making borrowing too cheap and saving too expensive, the Fed has now switched to mis-allocating capital by making saving too cheap and borrowing too expensive.
For many businesses, cash borrowing is now ‘too expensive’. While this deals with the inflation in asset markets - inflation that the Fed themselves induced with a decade or more of ultra low rates- it does nothing to address its stated aim of bringing down inflation on the high street. Indeed, because low rates artificially boosted supply, they were paradoxically deflationary and now by reducing supply of goods and service, these high rates are actually inflationary and thus, they continue to achieve the exact opposite of what they intend. Second, these high short rates are ‘crowding out’ capital elsewhere, as money comes out of credit and equity markets into cash, which is essentially then sat on the Fed balance sheet or recycled into supporting US government spending. Thus on the other side of the equation, for many investors the return on ‘no risk’ cash saving is now too rewarding’.
Currently the biggest challenge to markets is the high return on - and the high cost of - cash
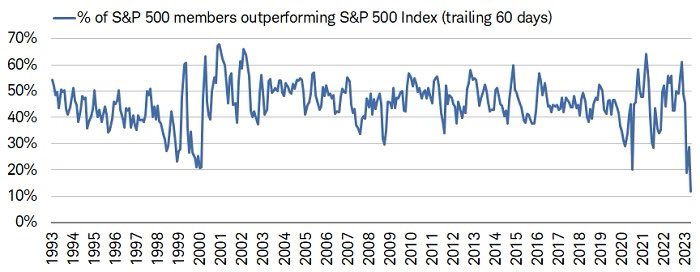
Meanwhile, the biggest problem facing active equity managers is the increasingly narrow breadth in the US market, with only 28% of S&P 500 stocks actually up this month, while the number of stocks in the S&P making a six month low is now the highest since October last year (the recent market low). In fact the number of stocks outperforming the index on a rolling 3 month basis is at its lowest level for 30 years - as shown in the first of two charts from our friends at Redburn.
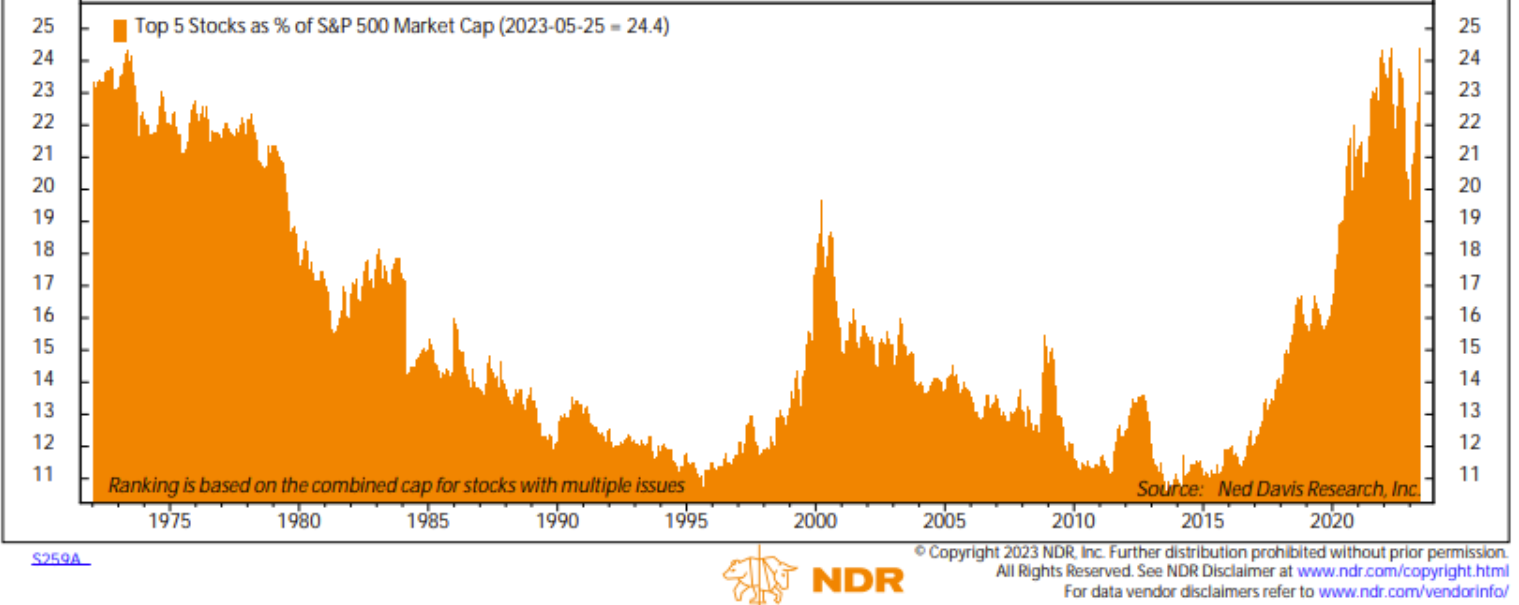
The net result, as the second chart shows, is that the top 5 stocks by market cap now make up 25% of the market – the highest level since 1972.
A Nifty 5?
This takes us back to the era discussed in textbooks such as Jeremy Siegal’s Stocks for the long run (1994) where he looked how the late 1960s and early 1970 saw the emergence of a so called Nifty Fifty and argued how even though the high earnings expectations of many of them did indeed come through, the multiples for many of them were simply too high to generate a return for investors. Thus we might be concerned if we are seeing a repeat of this, albeit not quite fifty stocks, or indeed 5, but maybe 7?
Evidentially, while the next 493 stocks in the S&P are largely flat year to date, the largest 7 stocks are up almost 50%.
Interesting, for those that think a bursting of this bubble is thus inevitable, Redburn also point out that history shows that after this sort of ‘hot streak’, the actual result is that the rest of the market catch up – a study by BMO shows a positive return of 6% on average over the next 6 months and 22% over 12 months.
FOMO or Momo?
One aspect of this is probably coming from the ETF effect that we discussed around 18 months ago – the idea that a stock will now be driven more by which large ETFs it sits in than by any fundamental analysis. The one we are looking at here is the US Momentum basket, which is a smart Beta index that essentially allocates to stocks with the strongest 12 month price momentum. There are then a number of large ETFs that track these indices and they rebalance every six months – right now they are rebalancing from 2% to 20% tech and in the opposite direction in Cyclicals like Energy and Mining.
Membership of one of the large ETFs can dominate a stock’s performance. In particular, the regular rebalance of momentum ETFs is causing some notable distortions
This is not unconnected, we suspect, with the fact that Commodities as an asset class appear to be having a tough time, with 36% of them now down over 40% from a 12 month high. However, we suspect that this has more to do with the 12 month highs – heavily influenced by recovering demand hitting supply constraints – than the true level of underlying demand. It’s easy to forget that only a year ago the Baltic Dry shipping index was at 3369, compared to its current level of 919, some 73% lower.
Short Term Uncertainties.
Outside of chasing mega cap tech, one of the biggest recent short term uncertainties for traders has been around the US debt ceiling, which is now seen as resolved. Interesting to note that while only a month ago the Fed Watch indicator of interest rate expectations based on the futures markets was said to pricing in a series of rate cuts by year end, that now appears to be more tilted to no change.
The debt ceiling itself has a number of aspects: First, it is to a large extent political theatre, as the deadline approaches, the two sides work out what looks best from a political viewpoint and thus it is always going to be a 'last minute' thing, but as with this time it always basically gets resolved. Second, while we talk a lot about the accumulated amount of the deficit and the even greater amount if we factor in actual future liabilities, the actual budget deficit on an annual basis would go into the positive if the US government simply cut expenditure to 2019 levels. Theoretically this is not very hard - it simply involves taking away a lot of the Covid excesses- but in reality it highlights the ratchet effect of government spending - once given it is very difficult to reverse. Third point, the short term practicalities are such that while the removal of the debt ceiling is a ‘good thing’ in terms of removing uncertainty, it is also ‘ a bad thing’ in that it means that we are about to get a slew of issuance, which would not only be a short term indigestion for fixed income, but could also drain liquidity from other markets already facing stiff competition from cash.
For markets, the risk is that the removal of the debt ceiling is likely to have a negative impact on liquidity
Indeed, one of the more important aspects of market mechanics and a useful indicator is the level of liquidity represented in the Treasury General Account (TGA) - effectively the US Governments ‘checking account’ at the Fed. Having soared in 2020 as the US Treasury sold Treasuries and raised cash in anticipation of ‘necessary stimulus spending’ this dropped sharply in 2021, flooding the markets and the economy with liquidity and driving prices higher in markets and on the high street. Having built up again in early 2022, this has been dropping steadily over the last 12 months, effectively once pushing liquidity into markets. Now the debt ceiling is lifted, we would expect new issuance to rebuild this and thus some of the current liquidity to be drained from markets.
Medium term risks.
As well as the impact of the ETF rebalancing discussed earlier, we suspect that the medium term asset allocators are also scrambling somewhat into NASDAQ futures – having been short last year, asset managers and leveraged funds are now heavily long. Possibly against a short in S&P, certainly the CME futures show hedge funds at close to a 20 year maximum on the short side. This, together with the rebalancing of the momentum ETFs, is likely to be exaggerating moves at the moment and doesn’t undermine a general view of international managers of a need to diversify away at least to some extent from the US.
A key point of focus for many asset allocators thus remains China. At the start of the year many simply ignored the notion of a China re-opening trade, before rushing in during February, only to see the trend appear to fail - even though it actually hasn’t. However, sentiment has clearly been hit and there is evidence of steady institutional selling from what we would refer to as ‘Fiduciary driven funds’. In effect, rather like with concerns over possible non ESG compliant stocks, large pension funds and insurance companies are divesting early to offset the risk that the rules will change and make them forced sellers at some point soon. This hits the more widely held ADR stocks like Ali Baba and also HK stocks like Tencent in a process that we would describe as ‘shifting from weak hands to strong hands’. In effect this means one side selling the rallies and the other buying the dips, creating some quite aggressive range trading.
China ADRs are in a two way pull between existing holders selling the rallies and new investors buying the dips
This is allowing many asset allocators to leave China in the ‘too difficult box’ for the moment. However, in terms of the actual fundamentals, the China economic surprise index went negative at the end of last year before reversing very dramatically mid January through until April. This has now reversed back again and is now 'neutral', mainly reflecting the fact that the consensus ignored the China re-opening trade and has now caught up. The market has largely followed the Surprise Index, both up and down, but this has an obvious flaw - as the economic estimates get revised up, (from 4.8% in December to 5.6% now, with 7.7% in Q2) so naturally the ability of the economy to ‘surprise’ goes down.
Tracking an Economic surprise index as if it were an earnings surprise index for a stock is a flawed strategy - albeit one being followed at the moment
The reality is that the China opening-up trade was always about travel, tourism and consumer spending, rather than manufacturing or infrastructure spending. Thus many of the traditional China growth trades put on were probably in the wrong areas. The bigger issue, however, is the perception, which is heavily distorted by the current, politically promoted, anti-China sentiment. Thus the positive Caixin PMI number for May is written off as misleading, preferring the weaker 'official' number, while the slowdown in exports in April (to ‘only’ 8.5% yoy) was highlighted when the jump from -1.3% in February to +14.8% in March was largely ignored.
In a similar way the narrative has shifted from the notion that China needs exports to keep employment up as its population is too large (bad) to one where China is facing a shrinking population - which is also bad. Meanwhile, India’s expanding population is seen as good, while Japan’s shrinking population is also seen as good. China’s housing bubble was bad, but so is the end of it, inflation was bad, but now lack of inflation is bad. And so on. The narrative spin is extremely powerful.
Any indicator that is currently seen as positive for Japan or India is deemed negative when that same data is applied to China.
There is nevertheless some useful information for investors; the fact hat China is now exporting less to the US than a lot of Asia countries are, while, inevitably, being presented as bad for China, is of course good for countries such as Vietnam, but also obscures the fact that China is going further up the value added curve in a way not dissimilar to Japan 50 years ago. We would look at the Chinese EV sector in particular to present the sort of threat to European and US car manufacturers that the Japanese did back in the 1970s and 80s. Ironically, because of the combination of narrative spin and fear of sanctions, many international asset allocators are looking to switch China back to Japan, encouraged by the fact that the Nikkei just hit a 30 year high - although what that really means is that at 31524, the market is currently no higher than it was in 1990, when it was heading down to a low of 7607 in 2003. Over the next decade it then double, halved and doubled again.
Long term Trends
The hype remains around AI – accelerated in the last month by the feedback loop from the AI stocks meme in Nvidia in particular – seen as the most ‘obvious play’ on the sector in terms of the ‘picks and shovels’. Of course, it wasn’t long ago that it was the most obvious play on bitcoin for the same reason. Without getting too distracted from the long term issues on AI, we can’t help feeling that the timing of the troubled ARK funds exit from Nvidia and the subsequent closing out of shorts helped create a lot of the positive momentum in the stock prior to the recent jump on the back of earnings numbers. We also suspect that, as we saw with the retail herd back in 2021, with stocks like Tesla in particular, that there has been a lot of aggressive short dated options trading driving gamma feedback loops as market makers keep having to buy the underlying as the price goes higher.
To return to the long term trend of AI, much of the discussion is in terms of its threat, rather than its opportunity, with dystopian visions of mass unemployment and a Terminator style future of robots and mega corporations – ironically given the ‘style’ of some of the articles probably written by an AI itself (!) While not dismissing these concerns, we would be both more optimistic and more sanguine. Sanguine is so far as acknowledging that, as with all technology. ‘bad’ people will almost certainly use AI for ‘bad’ ends, but that rather than quixotically trying to regulate AI, ‘good’ people need to create ‘good AI’ to counter it. Rather like creating a super hero to fight a super villain. More optimistic in that, as we noted in our recent post, we think AI will is the next step in the industrial revolution as a combination of man and machine and will increase productivity, quality and output of services while also being a major factor in driving down inflation.
Mo Gawdat, in his excellent book Scary Smart makes the point that we should think of emerging AI as being like children, they watch what we do, rather than listen to what we say and that if we choose not to participate in the ‘bad’ activities, they will come up with better ones. He also makes the point that the current iteration of Chat GPT has the equivalent IQ of around 155, but that the next version will be multiples of that, making it the ‘cleverest’ thing that has ever existed.
This chart from Visual Capitalist shows the challenge that will present to our existing systems.
The new smartest guys in the room?
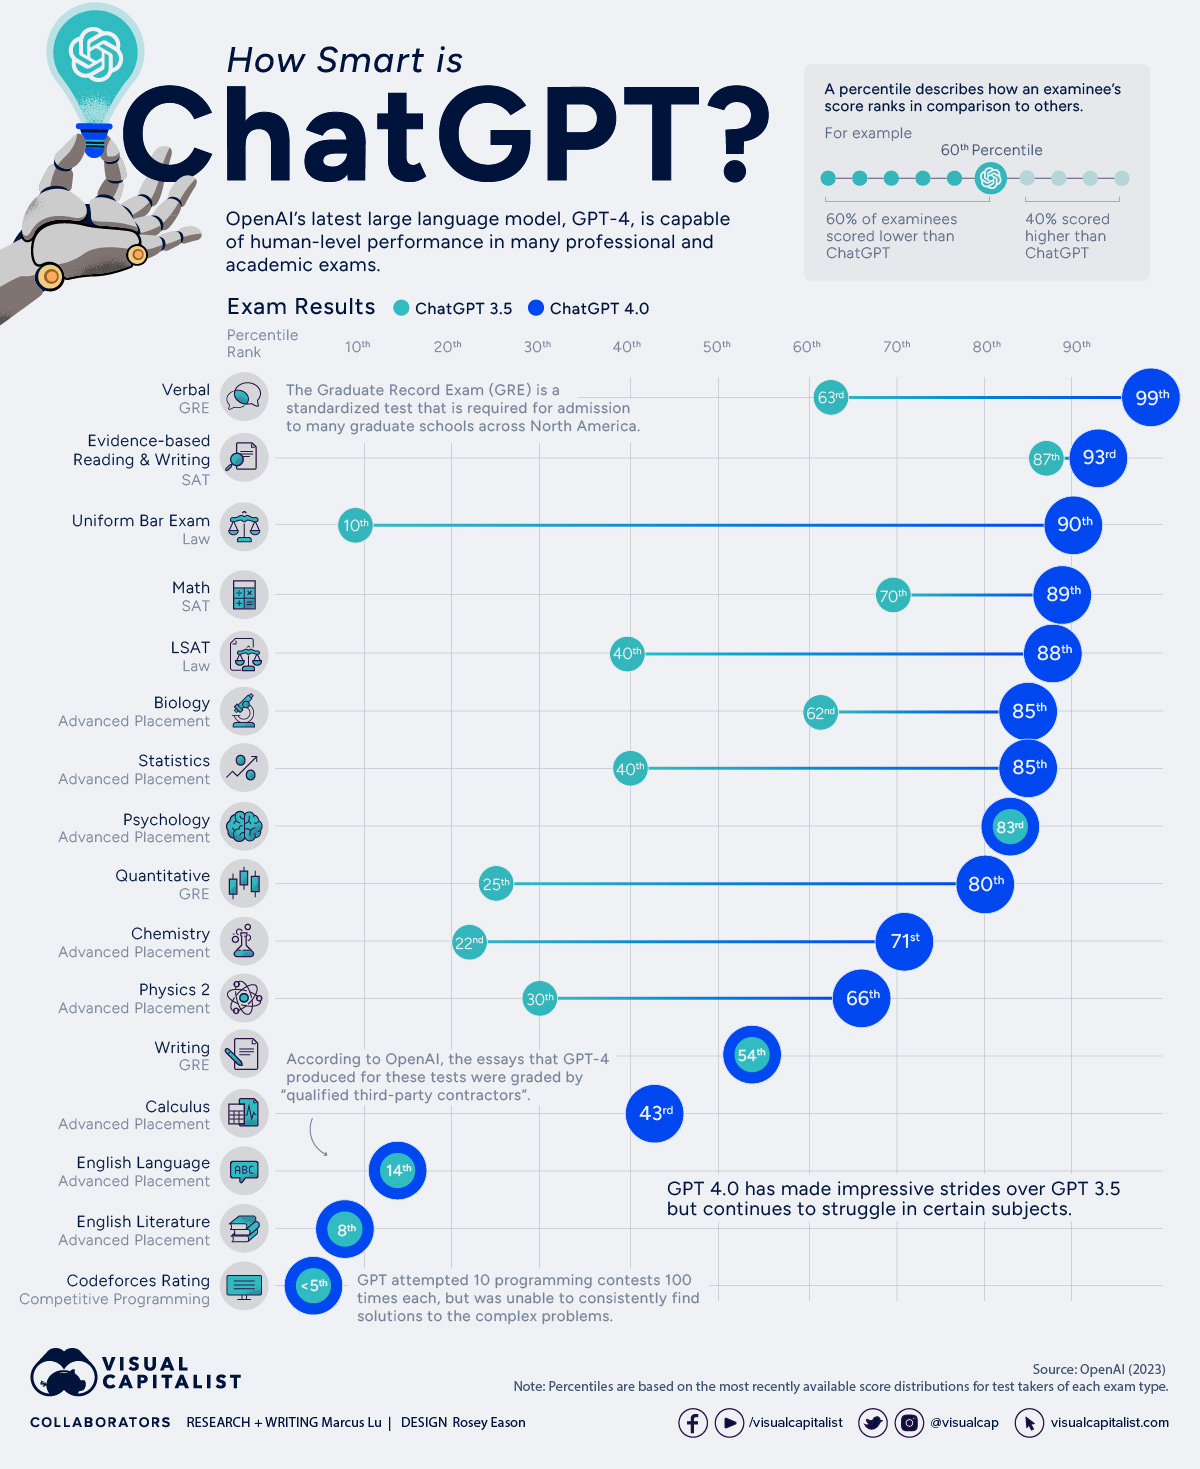
To benchmark the performance of Chat GPT version 4, versus its predecessor, Open AI simulated test runs of various academic and professional exams. As you can see, there is a lot of areas where it is already pretty much ‘the smartest guy in the room’.
For now, the market is trying to buy the ‘picks and shovels’ story, but as with the real winners from the Dot Com boom not emerging until several years later, AI as an investment theme remains very much in the early speculative stages. The biggest impact will come first at the economy level.
