


The much discussed concentration this year of the S&P in ‘The Magnificent Seven’ biggest tech stocks is part of a multi-year gyration between observed factors such as Value and Growth and Market Cap versus Equal Weighted indices. We believe that while there are multiple factors at work, two of the most powerful are the ESG complex and the behaviour of the large momentum strategies and the ETFs that track them.
A lot of market commentary seems to start with the premise that because the equity markets are up this year that ‘they are ignoring the economic reality’, when in fact 493 out of 500 stocks in the S&P500 are flat or down and it is only the so called Magnificent 7 mega cap tech stocks that are up, in many cases more than 50%. And none of that is anything to do with the economy, unless you count AI.
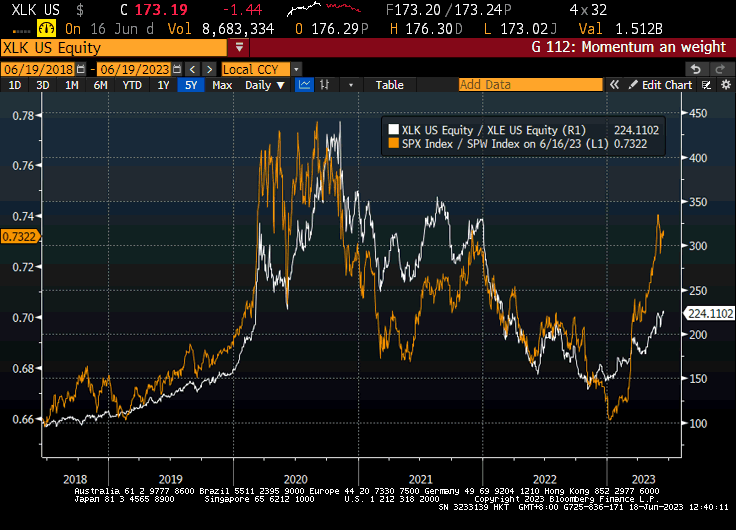
There are all sorts of biases embedded within this of course, but perhaps most relevant here is ‘recency bias’. Yes, the mega-cap tech stocks are up a lot, but then most of them were down a lot more in 2022 - having previously been up an enormous amount during 2020. It’s the old rule of maths, if you go down 50% you need to go back up 100% to end up ‘flat’. In the first chart, we show the relative performance of the US tech sector over 5 years, not against the broader market, but rather against US Energy stocks (in white). In orange we show (on a different scale) the performance of Market Cap weighted versus equal weighted S&P 500 Index.
Extreme Sector Gyration - Tech versus Energy.
The reason for highlighting the equal weight versus market cap weight is to illustrate that our view of ‘the market’ depends on the index we use, or rather the index we choose. In this instance, it’s not even Nasdaq versus the Dow, or the Russel 3000, it is literally the same group of companies, so it’s nothing to do with relative return expectations about the economy, the difference is only about the portfolio construction. You can have exactly the same views about the same stocks, but a very different performance depending on how you ‘weight’ them. Currently, the SPY, the ETF that tracks the market cap weighted S&P500, has quite literally ten times as much in Apple as it does in Exxon. Obviously the equal weighted index does what it says and thus has the same amount in both stocks, a 0.2% position in Apple, not a 7.2% position.
This then returns us to not only the active versus passive debate, but also the role of index arbitrage, especially with momentum and of course, ESG.
Equal weight is actually a proxy for almost any active strategy, since the in-house requirement to reduce benchmark risk, even for active investors, is a key source of limiting relative risk and hence relative return. Here, it’s not technically active versus passive, it’s passive versus passive - any apparent relative performance (and there clearly is a roughly 15% ‘alpha’ in either direction) is obviously not about picking stocks, as we said, it is simply a portfolio construction decision. But when market cap is dominating and the orange line is rising, it marks an environment that is very difficult for active managers. To outperform this year, you needed to not only have the Magnificent 7, but to effectively be overweight them - having more than 10x as much in Apple than Exxon.
Similarly with Tech versus Energy, our other line. In many senses it represents new economy versus old economy and much of the economy studied over by the Fixed Income markets is actually old economy stuff, so it’s perhaps not surprising if the (market cap weighted) equity market doesn’t appear to be looking at the same things. Apple and Oranges.
As we discussed (in the active versus passive debate), one of the only ways in which active managers can ‘beat the index’ is to take a different set of risks than the index either deliberately or accidentally. One way to do this is to take a very large ‘Sector Bet’, for example being completely underweight Energy and having an equivalent overweight in Tech. In other words, following an ESG strategy, which somehow ‘doesn’t count’ as risk.
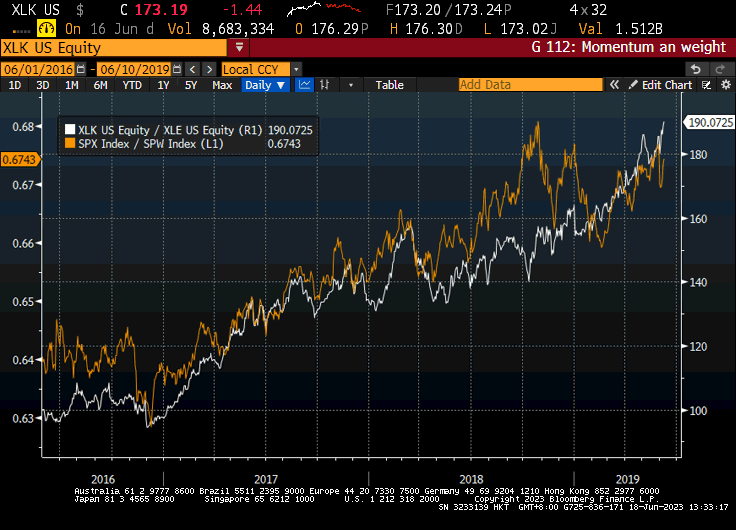
We don’t need to go back through the history of ESG again, other than to say that back in 2016, there was a lot of debate about Fiduciary duty to follow ESG, with a three year review announced by its proponents. Many remained unconvinced, but the apparent performance ‘gain’ illustrated in the chart below was a major factor - indeed, we would say that it was largely on the back of this hindsight portfolio that we saw so many large managers and their clients sign up for a ‘win-win’. The fact that not only did ESG allow you to benchmark yourself against an index that was not allowed to take the same bet, but also allowed you to charge a premium price had absolutely no effect of course. None at all. But it worked, overall, Reuters estimate that $285bn flowed into ESG in 2019, followed by $542bn in 2020 and $649bn in 2021 .
Win-Win, this large sector bet is ‘risk free’ (honest)
Front Running and Momentum
What we absolutely do know about markets is that once a steady flow is observed, the markets will get in ahead of the customer and try and ‘front run’ it. (Legally of course). In this case the ESG manager has a clear strategy and as money flows in, they will buy ‘more of the same’. Meanwhile, this inevitably starts to have an impact on the broader indices themselves, the index tracking funds, by definition, even though they are not officially ESG, put a lot more dollars in Apple than Exxon through the cap weighted effect and to the extent that they are ‘switched’ to ESG will be forced to sell whatever Exxon they have. Forced buyers and distressed sellers are of course manna from heaven for traders.
But, massive though it is, ESG isn’t the only game in town and after a huge out-performance of tech over energy at the end of 2020, things got more choppy. After a bizarre but now largely forgotten episode in 2020 when oil prices went negative, they rose from below $50 to over $80 during 2021, leaving the tech/oil momentum trade very stretched against the fundamentals, precipitating a dramatic reversal in 2022, as can be seen in the top chart. Which brings us to the final piece of the jigsaw.
The Momentum Effect
Chasing the top performing highest momentum stocks and selling the ones with the lowest momentum is a well known quant strategy - indeed Bloomberg captures this effect with its Pure Momentum Index, which is a constantly rebalancing Momentum Portfolio index, which as can be seen works some, but definitely not all, of the time.

However, what is interesting to us is the growth of momentum investing strategies, rather than momentum trading strategies, principally via ETFs and their potential to cause disruption. In particular, we focus here on the I-shares US momentum ETF, because it is large and liquid (around $9bn) as well as the I-Shares Global Momentum Portfolio that we use in our own Model Portfolios. For this discussion what matters in particular is that it only rebalances every 6 months, which leaves considerable room for arbitrage.
In markets like we have seen recently, a big sector rotation gets exaggerated by a semi annual rebalancing strategy
Thanks to the performance of the white line, the Momentum ETFs will have been skewed towards Tech at the end of 2021, then towards Energy during 2022 and now, Tech once again. It is our view that front running that rebalancing almost certainly contributed to the tech strength and energy weakness that we saw this year. Thus, prices were probably telling us nothing about AI on the one hand, or the expected demand for energy, or China re-opening on the other. They were simply telling us that one basket was going to be sold and another bought at the end of June, so get the right side of the trade.
Put simply, at the start of the year, the I-share Global momentum ETF had around a 7.9% exposure to Tech, a 16.1% exposure to Energy and a 25% exposure to Healthcare. As of the latest rebalancing, Healthcare is down to 14.7%, while Information Technology is now 20.5%. Energy, meanwhile, is back down to 3.78%.
In effect, health and Energy are both down over 10%, while Technology is up over 12% just on the rebalancing
Obviously, ahead of that rebalancing, it would have made sense to be running a momentum strategy to be long (probably via options) the ones that were ‘bound’ to go in and short the ones ‘bound’ to come out - which would go a long way to explaining the amplification of the sector rotation. This is not to say that the ‘new’ momentum ETF will now under-perform, nor that the strong momentum Tech stocks will, but more likely to say that the energy and healthcare stocks, having effectively been front run into the rebalance will no longer have much forced selling.
To Conclude
Equity Markets year to date are only up if we take a narrow definition based on market cap weightings that do not capture a ‘view’ on the economy. As such they are not ignoring the broader economy. Instead, they reflect a large number of technicalities, in particular the ongoing rotation between Energy and Tech stocks that originates from the ESG complex and trading ahead of those flows, together now with the addition of momentum based ETF strategies that are exaggerating the effects of semi annual rebalancing.
