


In the last post on Active versus Passive, we made the point that a lot of the issues facing active managers are actually structural, in particular the inability to take a different set of risks to the market - either more or less - on account of, ironically, risk management. In the context of bringing solutions, not problems, we have spent the last three years constructing a number of Model Portfolios (and discussed them on the market-thinking blog) that explicitly try to remove those structural issues and allow us to be explicit about exactly which risks we are taking, and which we are not.
The underlying philosophy of Market Thinking is that long-term investors need to take account of the motivations and behaviours of medium term asset allocators and short term leveraged traders in assessing their risk return. Our process is such that we translate our understanding of these influences into what we term a conviction score - in effect, a measure of relative confidence about risk and return.
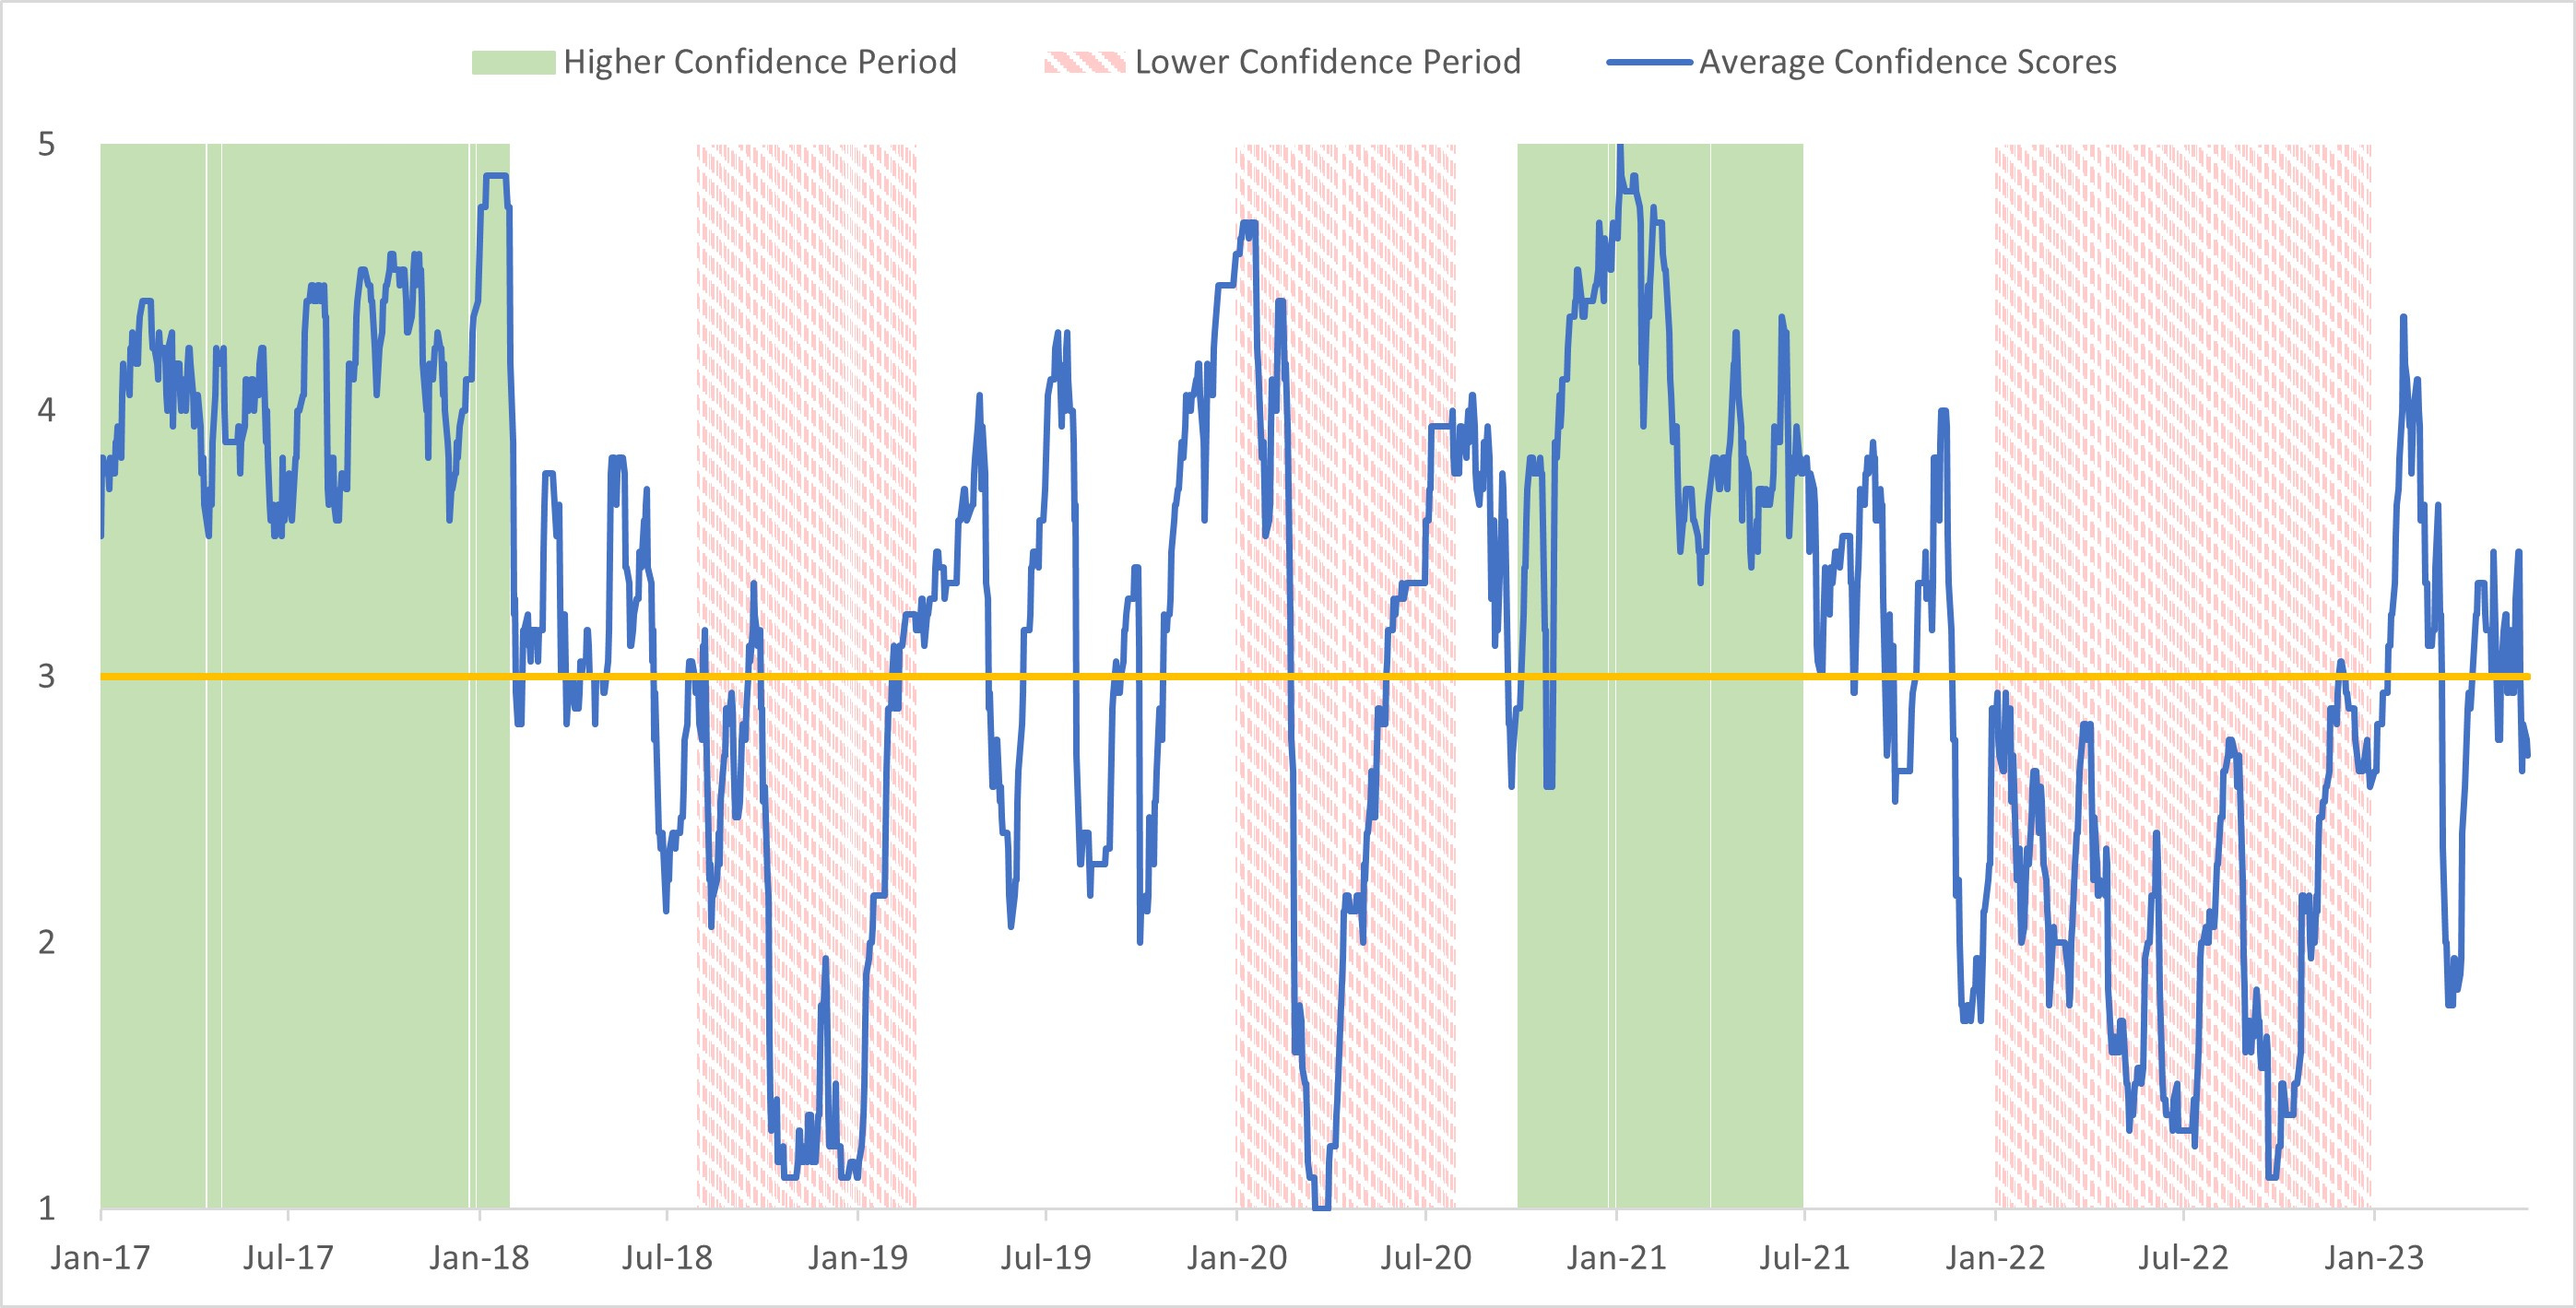
The idea is, that via our portfolio construction, we can avoid one of the key constraints on most active investors and take more risk than the market in periods of high conviction, but a lot less risk than the market in periods of low conviction, or low confidence. Why hug a benchmark that is going down? The chart illustrates these periods for Global Equities, according to our models, over the last 6 years.
High Confidence and low confidence periods - 2/3rds of the time
(note all charts from Market Thinking)
Thus we can see that over the last 6 years we have had periods of either extended high (green/shaded) conviction or low (pink/cross hatched) conviction or confidence scores - for approximately 2/3rd of the time. No process can realistically out-perform all of the time, but we believe that, by taking the appropriate risk at the appropriate time we should be able to ‘do better’ in positive conviction markets on account of the bias to long duration and growth in the thematic part of the portfolio and also ‘do better’ in negative conviction markets on account of not having to be fully invested in a falling market. If we have no conviction on anything, why would we buy?
In this example we have created a ‘balanced portfolio’ from our two Global Equity Model Portfolios; taking a 40% weight from our Global Factor Portfolio and a 60% weight from our Global Thematic Portfolio, and then plotting the average confidence/conviction score. If we extend this back to look at a broader market index, the pattern is similar, with confidence trending positive or negative in even more than 2/3rds of the time.
The following charts then illustrate this effect via the performance of the model portfolio during these periods.*
High Conviction - take more risk
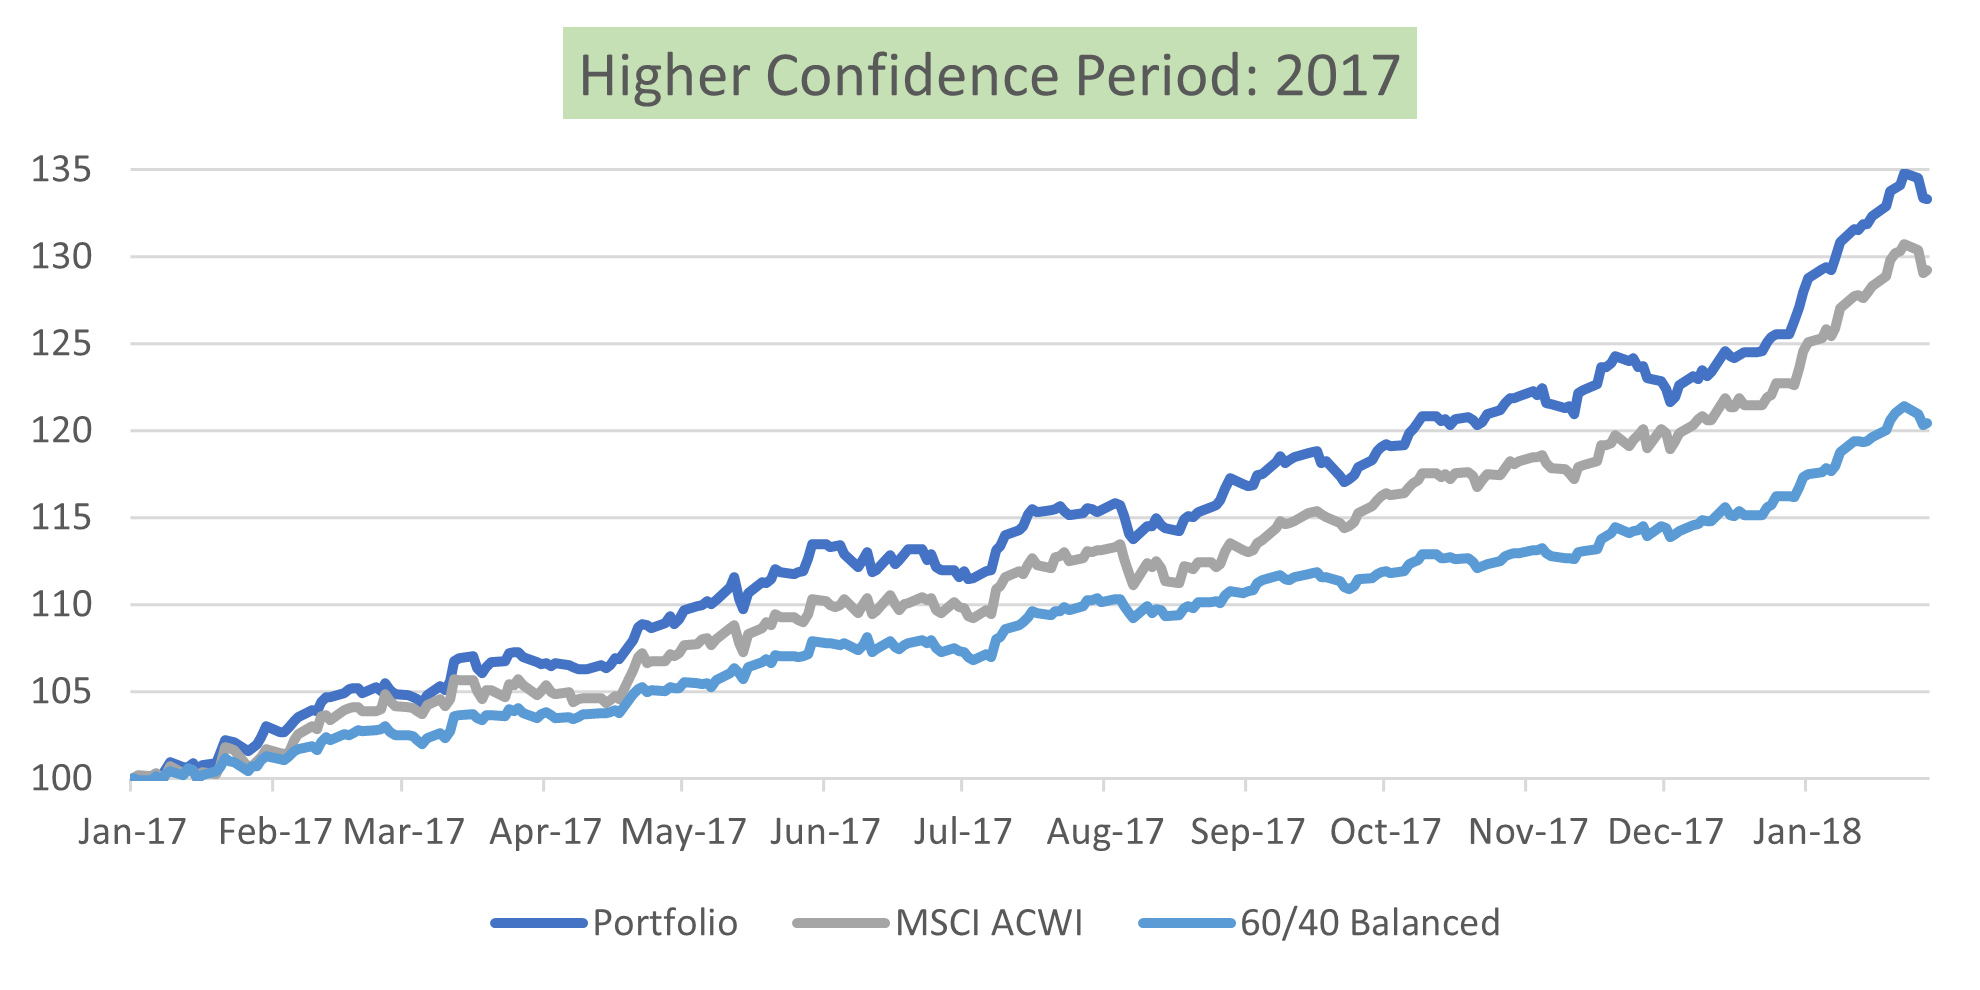
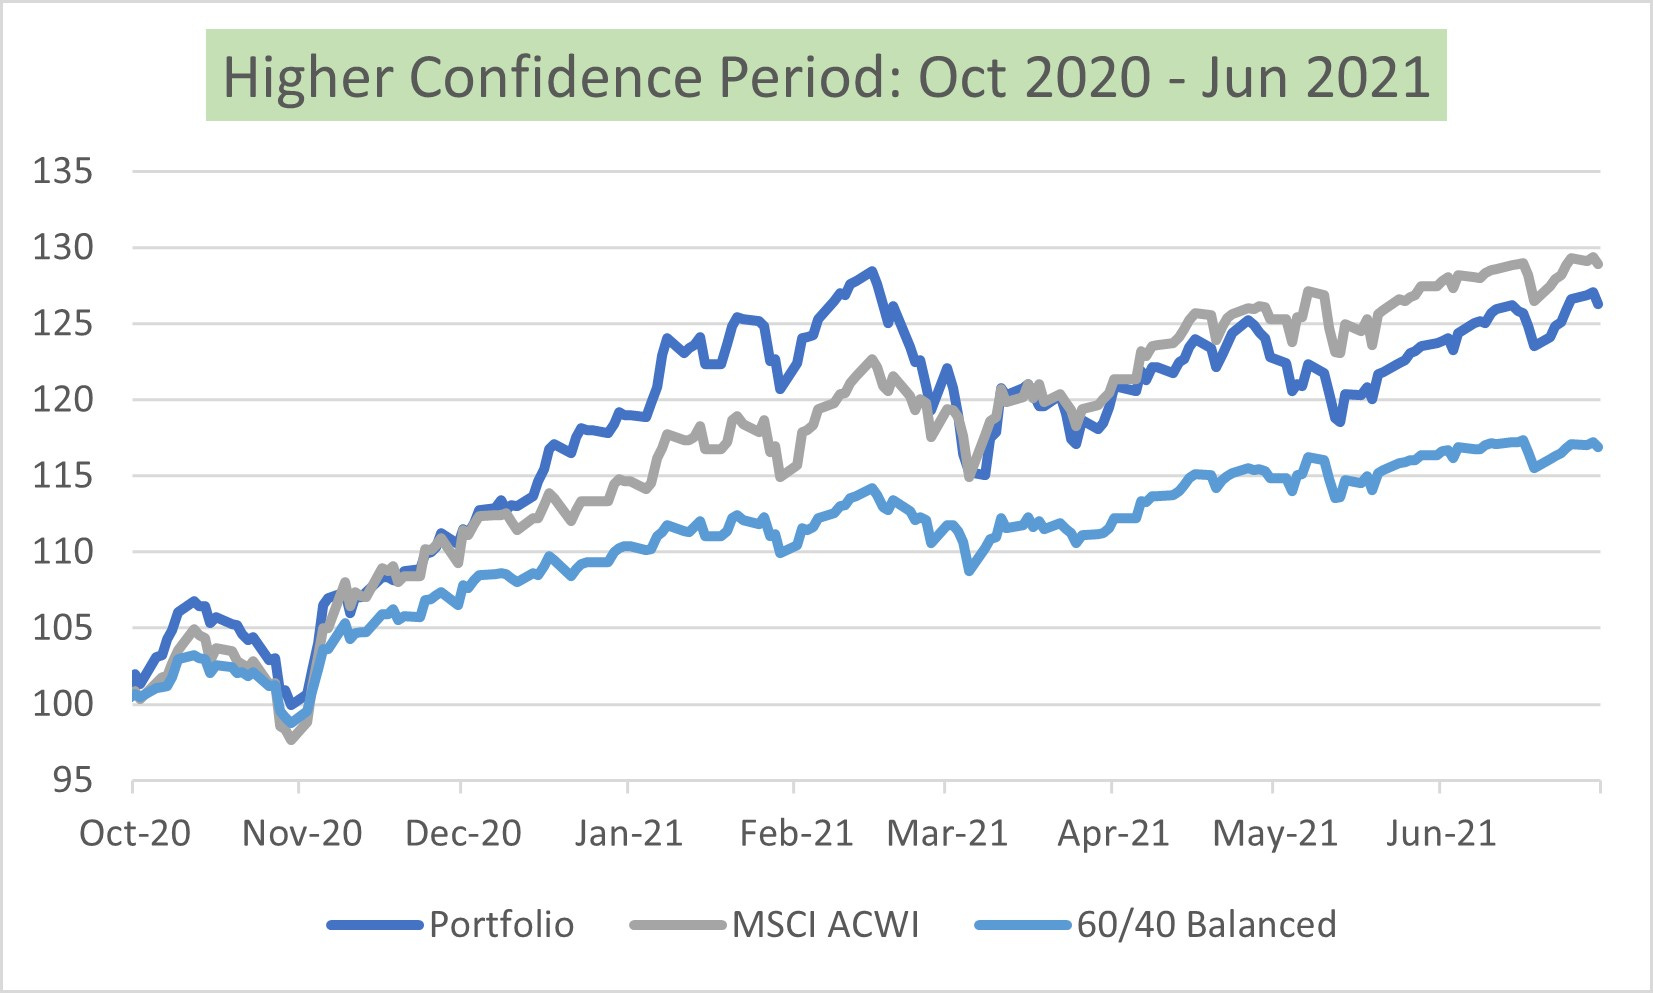
Thus in both of the recent ‘high confidence’ periods, the model kept up with and indeed beat the ‘benchmark’, here defined as the MSCI All Country World Index, principally on account of the bias towards higher beta and growth areas at the time.
- Interesting also to note the portfolio starting to ‘lag’ the index towards the end of the period, albeit still going up, principally as the ‘meme’ stock period took over and forced a small number of stocks aggressively higher, a form of concentration risk very similar to now. The diversified nature of the model portfolios is such that we would not expect to outperform this type of market.
If we then look at the ‘low confidence’ periods, we see the same thing - the model portfolio also outperforms, although in this instance it does so mainly by not going down as much, but then ‘keeping up’ with the subsequent recovery. This reflects the concept of losing least, when, not if, you get it wrong.
Low Conviction, take less risk and reduce both downside and Volatility
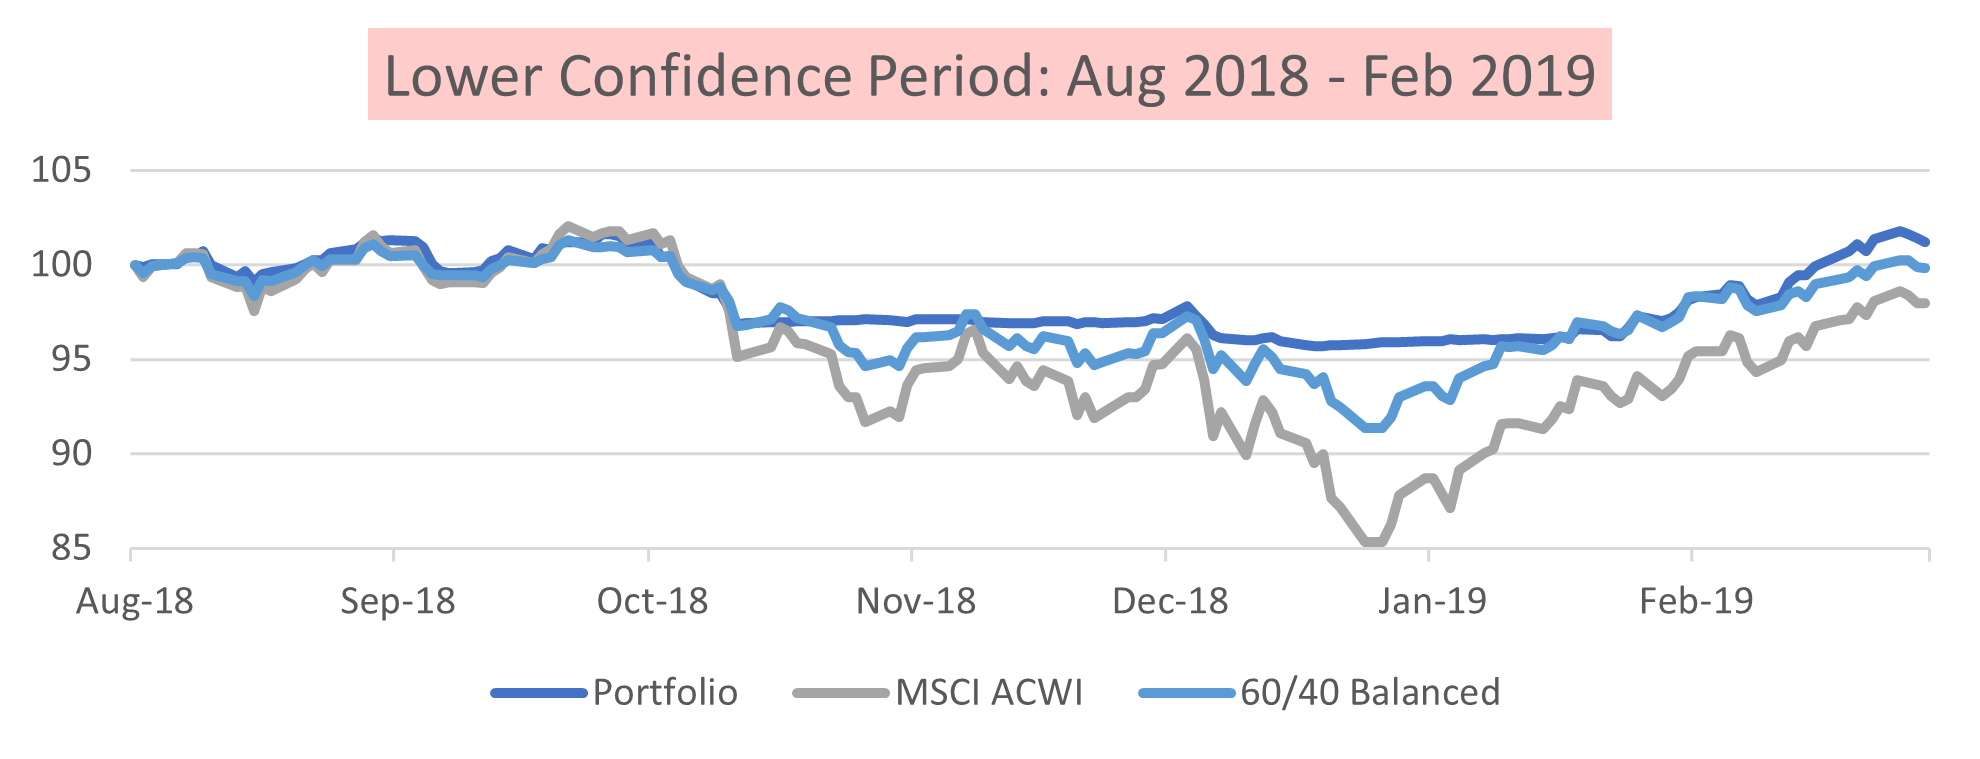
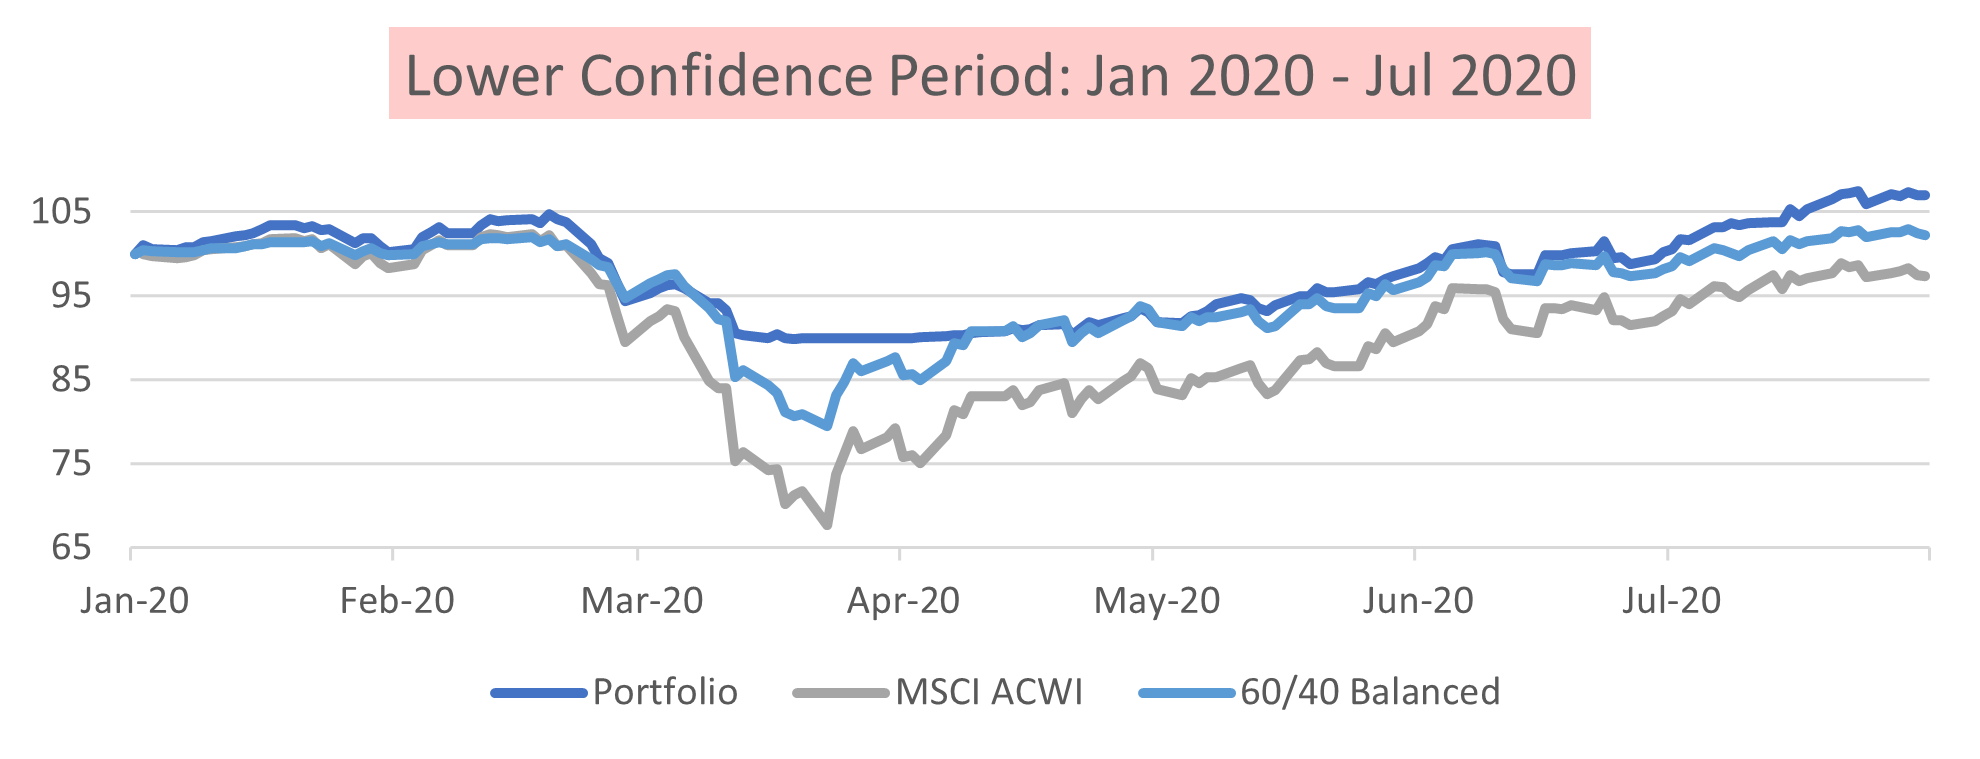
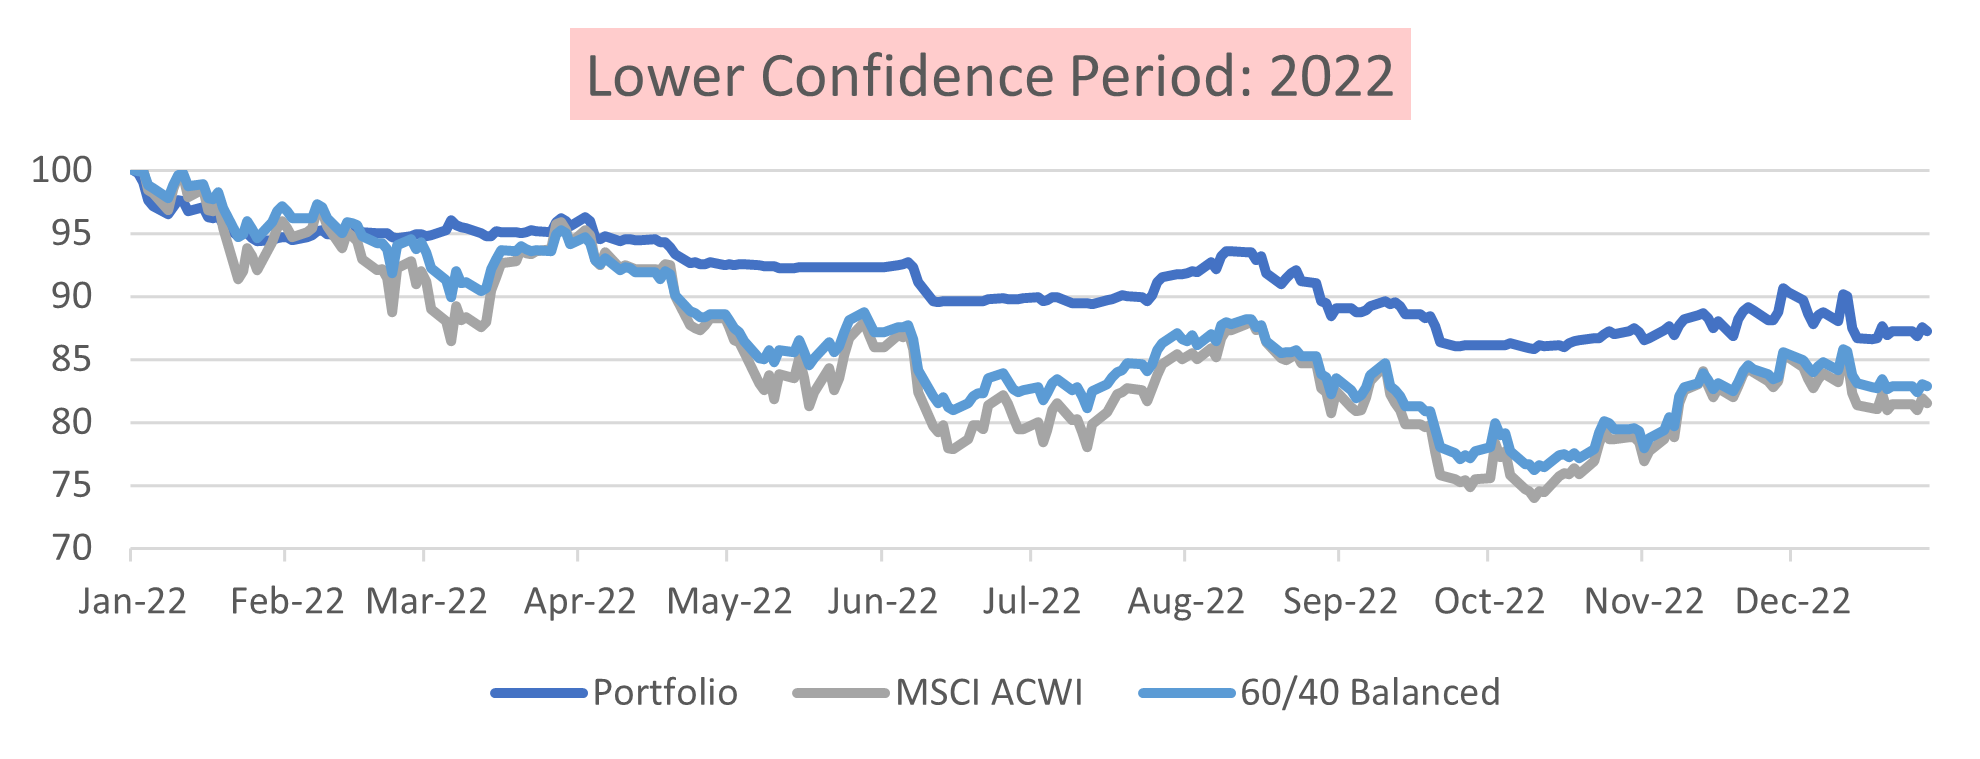
- Note how the meme stock period of late 2021 mentioned earlier was followed by a much lower confidence period as shown in the lower chart here, with significant absolute and relative drawdown for the benchmark during much of 2022
Of course, if we simply measure ‘bottom to top’ for any particular discrete period - say a recovery period like October to December 2022 in the bottom chart - then the performance of the index will be ‘stronger’, but that obviously reflects a base effect, which is why it is better illustrated by a longer term chart, that shows the cumulative effect of being able to vary the risk profile of the fund according to market conditions.
Combination, adjust risk with confidence, the cumulative effect
Volatility
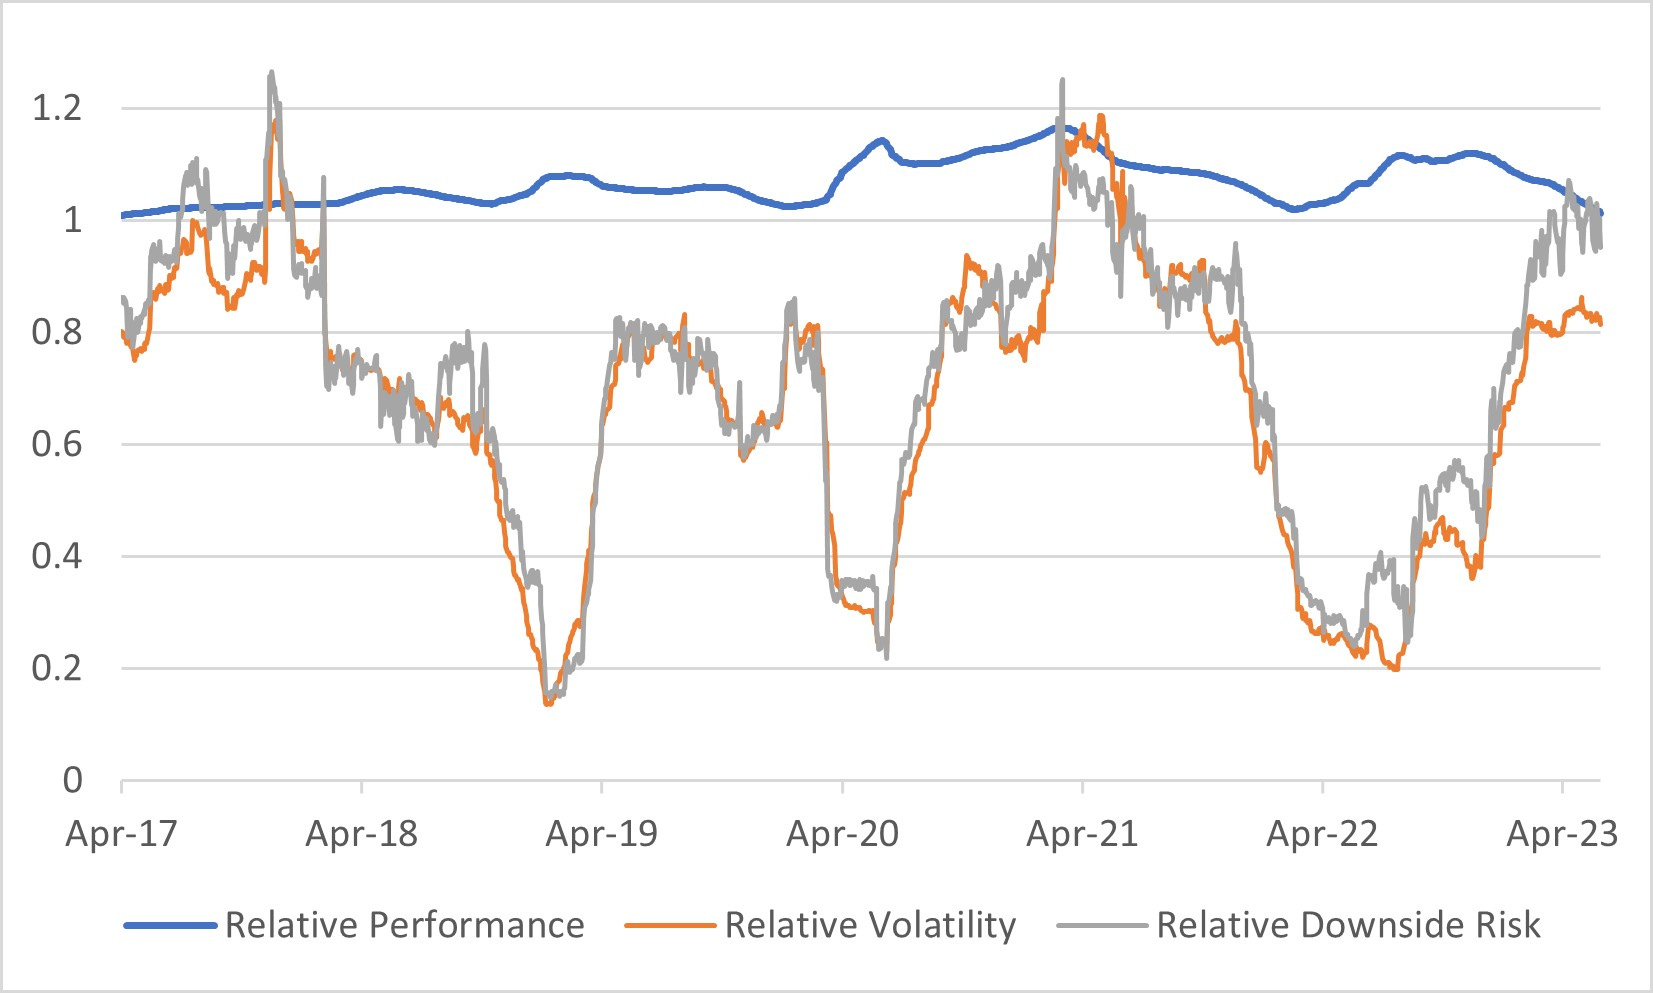
Notice that in all the charts, we have also included as a second ‘benchmark’ a balanced fund of 60:40. This is because for many ‘core portfolios’, investors want to take ‘less risk’ in terms of volatility, and thus are happy to accept lower return. Our point is that by allowing the flexibility to have less risk than the market in lower confidence periods, we can also achieve a lot less volatility, but without having to give up so much return.
This is illustrated by the following chart, showing relative performance in blue and relative volatility and relative downside risk in orange and grey respectively.
Model Portfolio, positive relative return, with much lower volatility and downside risk
To conclude. Based on our own experience, we are very aware that many of the issues facing active managers are structural to the investment management industry itself, in particular the focus on limiting volatility and benchmark risk that constrains the ability to outperform rising markets on the one hand, while locking the manager in to match underperforming markets on the other. This has been the motivation behind us designing model portfolios that bypass these constraints, allowing us model better relative returns while still taking ‘lower risk’. *
*NB we have been running these portfolios since 2020 in beta test mode with real money to ensure they are actually actionable. As discussed in previous articles on market thinking, the capital is allocated into large liquid ‘Smart Beta’ ETFs that capture Global Factors and Global themes and rebalanced on a weekly basis in line with the conviction score of each underlying component. The last three years have thus been a perfect ‘test bed’ for different types of markets!
